Over the past five months since my website has started, I’ve seen my views go up and down so much that it’s hard to predict, and I became way too focused on the amount of views I was getting. It would get to a point where I wouldn’t want to look at the Analytics because I was worried my website hadn’t done well enough recently, and I didn’t want to see it, which you can liken to ignoring a lump and hoping it would go away. Recently though, I’ve become less focused on the number of visitors and more interested in the quality.
I take steps everyday to make sure that my quality of reader is improving, whether it means installing a new plugin to help direct traffic to certain places, or posting photos or polls on Facebook, encouraging visitors to get more involved. Through the past few month, I’ve started to see my different techniques take effect as my quality of visitor has gone up.
How to Track the Quality of Reader
I like to look at my website in periods of a month and see how my progress has improved, and there’s four different factors that I look at – Pages/Visit, Time on Site, Bounce Rate and Percentage of Returning Visitors. Looking at the amount of pageviews, unique visits, and visits per day is nice, but they don’t tell you much about the type of person viewing your blog. There are days when I reach a huge spike in traffic and make noticeably more money, but I always prefer quality over quantity as that’s my target market.
How Has The Quality Improved
Pages Per Visit
The first factor we’re going to look at is the amount of pages per visit that the average reader looks at. This is one of the best indications of the quality of visitor you have because the more a person views, the better they are. My website officially launched at the end of April, but I’m starting with the month of May just to make it tidier. You’ll see in the graph below that I track the progress for 5 months, all the way up until the end of September.
This graph above is a good indication of what my visitors are doing and it’s good to see that for the most part, the pages per visit has improved. With any luck, I should be right on target to get two page views for every visitor each month, or so it may seem at least. The truth of the matter is that there’s going to be a lot of people who only view one page when they visit, and then there’s also a strong group of visitors who look at over ten. One of the many great things about Google Analytics is that they tell you exactly how many pages were visited by each visitor, in the visitor loyalty section.
I’ve had to separate my results below into two different graphs because the amount of people that only visited one page in their visit is actually six times as many people as visited twice. You’ll notice that all of these months have the majority of the visits only viewing one page, which is usually the page that they’re linked to.
The details are above are nice to know because they provide me with information that counts towards my views and tells me the amount of poor quality visitors, but I’m really only interested in the high quality visitors and for this, I need to see who’s clicking on more than one page. Below is a graph of all the people that view more than one page in a visit, spread across the five months I’m comparing here. All of the months are pretty similar at first glance and the results are pretty much how you would expect, that is, until you look at the last category of 20 or more visits.
The spike in the 20+pageviews section can easily be considered to be my regular following so it gives you a good idea of how well you’re doing. It’s best to look at this online and simply change the month that you want to compare as it’s easier to read, but I can tell you that June, which had basically the same number of views as September had a third less people over viewing over 20 pages each month, which shows me that my following is growing and the quality of visitor is going up.
Average Time on Site
When you look at your dashboard, you’re told the average time spent on site for each time period that you have selected, and for the past five months, mine looks like this. This is a good indication of how well your site is doing, but if you want to know the finer details, you have to look further by looking at the length of visit section under visitor loyalty in Google Analytics.
When you have a look at the average length of visit on the site, you’ll see that not only do most people only view one page, the majority of them only stay for 10 seconds or less. This isn’t what you want, but it’s ultimately hard to avoid, although there are steps that you can take to reduce this percentage, but we’ll get to that further down this post. Lets have a look at how long my visitors stay for, divided up into groups of time as percentages for each month. You’ll notice that the majoirty of visitors only stay for 10 seconds or less, but that’s not really a problem.
From looking at the graph, you’ll see that when you compare September to May, you’ll see that there is a lot more more people who are staying for 61 seconds and longer and less people staying for a minute or less. The aim is to get the all the time under a minute, specifically less than 10 seconds, to be as small as possible. The progress I’m making so far is pretty strong, but the main difference between September and July is the lack of spikes in traffic produced by top lists. Not having these spikes in traffic haven’t been entirely bad because I can see clearly that the quality of visitor that’s now following me has improved greatly.
Bounce Rate
The bounce rate is the percentage of visitors who view one page and then leave straight after without browsing the site anymore, so you want this to be as low as possible. As you can see, this is a little bit harder to control and large spikes in traffic, or traffic from certain sources causes this rate to go up quite substantially. If you compare May when my website was first starting out, with September where I’ve built a strong following (now 1100 fans on Facebook), you’ll see that people take my site more seriously because of the amount of content that they can find on there and because of certain visual improvements I’ve made.
Returning Visitors
The improvement in bounce rate has a lot to do with whether the visitor has been on your site before, because if they have then they’re more likely to stay for longer as they’re familiar with what you have to offer. To do this, you need to look at the percentage of new visitors page in GA. It’s common to think that if the percentage is low then you’re not reaching a new, wider audience, which is true to some extent, but that’s not what is important to start with. You’re better off writing great content while you find your way through Google and then as your website grows you’ll become more popular. It takes a while to build a good website, so give it time.
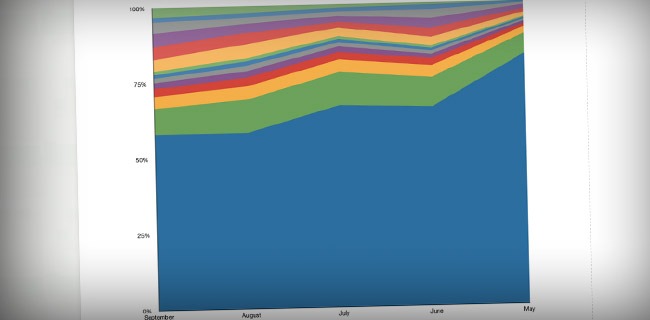
My favorite stat to look at when trying to gauge the quality of visitor that my site is receiving, is the visitor loyalty stat. It will tell not only how many people have visited before, but how many people have visited your site in a certain time period, from one single view to over 200 views. When you take some time and put these into a graph like I have, then it becomes really easy to compare. Have a look at my graph below.
This shows the amount of people each month who are visiting my website multiple times and if you compare May on the right with September on the left, you’ll see that the amount of people who only visit my site once in a month has gone down from around 82% to 58%. This is one of the best improvements to track as it tracks visits and not pages per visits, so it’s easy to see if your following is improving. You’ll notice that the biggest improvements are in the 9+ visits a month section, where I’m starting to see a steady following.
How to Improve Your Visitor Quality
This is actually easier than you may think, and if you’ve managed to read through the material above, then you’ve probably got a few ideas of your own by now. We’re going to look at each factor in order and see what steps you can take to improving it.
Firstly, we can try and improve pageviews, and this is surprisingly easy to improve, it just takes a little time before it starts to take effect. I’ve managed to improve mine quite substantially by the installation of a single plugin which does most of the work for me – SEO Smart Links. I’ve mentioned it multiple times on this site before, but it’s always worth mentioning again because it’s a really powerful tool. It will take all of the keywords that you input and assign them to links that you also input so that every time one of these keyword terms pops up in the text, it becomes a link and starts to send people to different pages on your site. I have my plugin set up so that it will link a maximum of three times for each keyword so by the end of the post, with about 80 keywords listed, I can have a huge amount of links sharing other pages on my site with people. This has proven to work as the more links I input, the higher my pages per visit seems to become.
Time on site is slightly more difficult as there’s a lot more factors to it, but of course the SEO plugin does help. One of the biggest changes that I’ve made which I think has improved time on site, is my writing. As I’ve written more, my style has improved, along with my grammar and structuring. I looked back recently on a post that didn’t make it to publish, although I was considering using it, and in my opinion it was unusable. I was clearly struggling with what to write and the content and length was suffering. It was a typical ‘Top 10 Reasons…” style post (which are usually a little shorter), but had just 566 words, and when you compare that to one I wrote the other day at 1634 words, there’s a big difference. I don’t do anything to bulk out the text at all anymore like I may have done in school tests when you didn’t know the answer – I just included everything that it required. The more recent posts can be done a lot quicker now as I know a lot more about what I’m writing about.
Bounce rate is pretty hard to control because the majority of the percentage comes from those who are only on the site for 10 seconds or less, and there’s not much you can do for them. When you do get to people who get to the end of a post but don’t browse any other pages, you need to add a reason for them to want more. At the end of every post I’ve included a related post section to give a more visual example of what else I have to offer. This encourages them to explore more site for longer and click on more than one page.
I’ve also made my site a lot more personal in the past few months, by including more anecdotes, not just on my website, but on my Facebook too. Most tutorial sites contain a lot of different writers, but on my site, it’s basically me and I think that people can start to relate to that a lot better. I used to copy and paste the same 4 lines to the bottom of every post asking people to come and visit Facebook, Twitter and to subscribe to the RSS feed, but it didn’t really feel very personal. I’ve recently stopped doing this and now I include a short sentence or two related to what I’ve been writing about and I have an image which encourages people to come to my Facebook. I’m still trialling this, but I can tell already that it’s having a very positive effect. To encourage new visitors to come to my site, I use my Twitter marketing to meet new people in my niche and then when they follow me back, I send them a message encouraging them to come to my fan page on Facebook. This can be a slightly slow process because you can’t really guarantee that they’ll follow back, but when they do, I find that about 25% of them will click on the link to my Facebook. To make sure that they want to click ‘like’, they’re taken to my welcome page where they’re greeted with this image.
I don’t know about you, but when I see this, I like to see the wall’s activity before I like a page so this is only half of the job. I interact daily with my fan page, whether I’m posting new photos, making polls, or posting quotes and tutorials and all of this makes my Facebook page look more interesting than anyone else’s. Because of this, my fan page has grown as a very good pace, and it grows faster, the longer it’s been around. Social media is a big part of my marketing as it shares my page with people who may never have heard of it before, while making them feel as if they’ve stumbled upon it themselves.
From my experience, people are more interested in talking to a person than to a website and that’s why at the end of every post, I have an about the author section, similar to the one on this page. It’s like shopping with an independent store rather than a big corporation – you know who you’re talking to, and you can come back and talk to them again. When you’re a massive website, you may not want personal interaction, and that’s fine, because you’ve already made it, but while you’re still growing, try your best to add a personal touch. When people comment on my posts on this site, they usually call me Josh (sometimes Mike), and that’s good because it helps to build a personal relationship with your following.
Hopefully you’ve learned something about how to make improve your quality of visitor and build a website that people want to follow. If you have any more questions about what we’ve covered here today, or need help with Google Analytics, please feel free to ask.
Related articles
 Making The Most Of The Google Analytics Intelligence Feature
 Google Analytics For Bloggers – The Definitive Guide
 Make The Most Of A Custom Google Analytics Report & Segments
 Google Analytics Goals – Setup Guide
 Website Features That Will Make Your Site More Usable
 What to Put on Your Blog’s Homepage
 Essential Blog Tracking Tools | Research and Analytics for Bloggers
![[GET] Polaris for Google Analytics](http://seo.maxiaodong.com/wp-content/plugins/wordpress-23-related-posts-plugin/static/thumbs/2.jpg) [GET] Polaris for Google Analytics
[GET] Polaris for Google Analytics 10 Blog Customizations To Make Your Blog Perform Better
 7 Fast Fixes to Increase Your Website’s Conversion Rate
 Blog Spring Clean | Things To Remove From Your Blog
 12 Conversion Boo-Boos That Make Your Website Stink